Photo Credit: Sarah Crabill/Getty Images
If I hear one more argument that the racing now is like it was in the old days and that fans of old school racing should love fewer cars on the lead lap and domination, my head may just explode.
For some reason, there are fans that are going to defend this type of racing we are seeing in 2018 no matter what. Those same people will throw out the lines of, “well, in the old days there were only a couple of cars on the lead lap” or “you people should love domination because that’s the way it used to be.” Stop! If you want to get into this debate I’m ready to take you on and hit you with some statistics of my own.
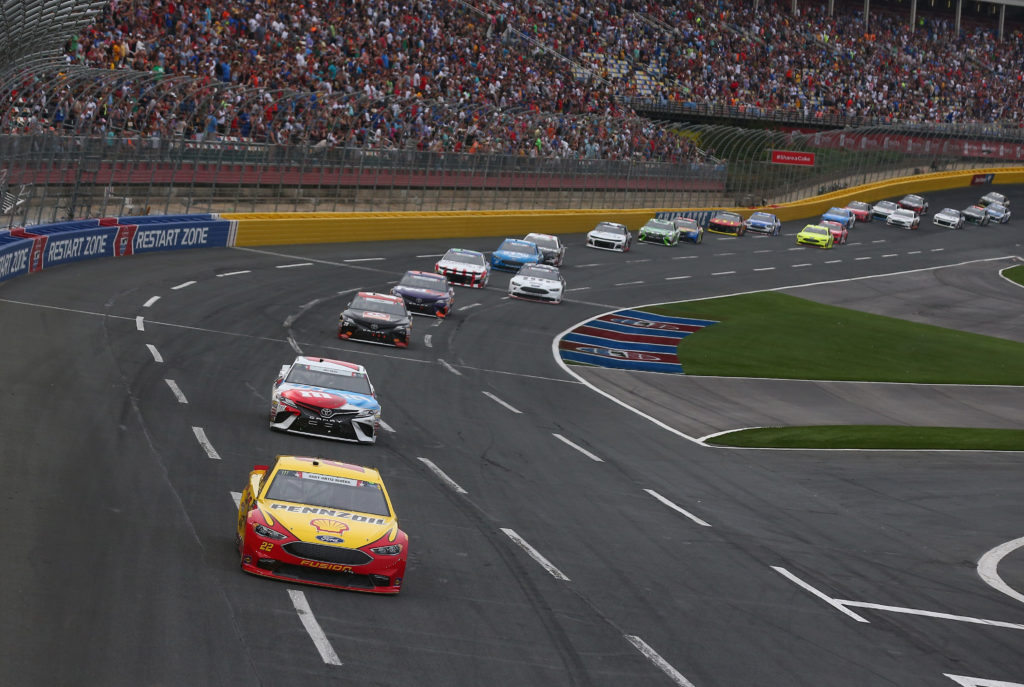
It was pointed out on Twitter that the 2018 Coca-Cola 600 had a lot of similarities to the races of yesteryear and that the old school fans should be bursting with excitement after seeing a race like that. Well, I like to think I am a huge fan of ’70s-mid ’90s NASCAR and the only thing I was bursting with after this year’s 600 was nausea. So if you want to get into this debate and try to flesh things out on just how similar the 2018 Coca-Cola 600 was to old school racing let’s have at it. I will compare this year’s 600 to the 600’s starting in 1968. That should be a great sample size.
| Year | Cars Started | Lead Lap Cars | Lead Changes | # of DNF’s | Margin of Victory | Most Laps Led | Notes | % of Cars DNF |
| 1968 | 44 | 2 | 16 | 10 | Caution | 98 | Only 255 laps ran | 22.73% |
| 1969 | 44 | 1 | 13 | 26 | 2 laps | 274 | 59.09% | |
| 1970 | 40 | 1 | 28 | 23 | 2 laps | 141 | 57.50% | |
| 1971 | 40 | 2 | 13 | 16 | 33.9 | 303 | 40.00% | |
| 1972 | 40 | 2 | 22 | 23 | 23.7 | 239 | 57.50% | |
| 1973 | 40 | 2 | 23 | 21 | 1.800 | 220 | 52.50% | |
| 1974 | 40 | 2 | 22 | 23 | 23.700 | 239 | 57.50% | |
| 1975 | 40 | 1 | 17 | 12 | 1 lap | 234 | 30.00% | |
| 1976 | 40 | 2 | 37 | 17 | Caution | 230 | 42.50% | |
| 1977 | 40 | 2 | 25 | 13 | 30.800 | 311 | 32.50% | |
| 1978 | 40 | 6 | 43 | 12 | 2.000 | 144 | 30.00% | |
| 1979 | 41 | 3 | 54 | 22 | 5.600 | 175 | 53.66% | |
| 1980 | 42 | 2 | 47 | 21 | 0.500 | 157 | 50.00% | |
| 1981 | 42 | 2 | 32 | 21 | 8.200 | 140 | 50.00% | |
| 1982 | 42 | 2 | 47 | 20 | 0.200 | 122 | 47.62% | |
| 1983 | 41 | 3 | 23 | 13 | 0.800 | 188 | 31.71% | |
| 1984 | 42 | 2 | 22 | 15 | 17.000 | 156 | 35.71% | |
| 1985 | 42 | 3 | 29 | 20 | 14.640 | 97 | 47.62% | |
| 1986 | 41 | 6 | 38 | 10 | 1.590 | 98 | 24.39% | |
| 1987 | 42 | 1 | 23 | 25 | 1 lap | 186 | 59.52% | |
| 1988 | 41 | 6 | 43 | 18 | 0.240 | 106 | 43.90% | |
| 1989 | 42 | 3 | 22 | 17 | 0.990 | 138 | 40.48% | |
| 1990 | 42 | 11 | 15 | 17 | 0.170 | 306 | 40.48% | |
| 1991 | 41 | 6 | 22 | 19 | 1.280 | 263 | 46.34% | |
| 1992 | 42 | 7 | 28 | 20 | 0.410 | 141 | 47.62% | |
| 1993 | 41 | 8 | 29 | 12 | 3.730 | 152 | 29.27% | |
| 1994 | 43 | 6 | 24 | 13 | 3.910 | 187 | 30.23% | |
| 1995 | 42 | 3 | 32 | 14 | 6.280 | 169 | 33.33% | |
| 1996 | 43 | 4 | 20 | 10 | 11.980 | 199 | 23.26% | |
| 1997 | 42 | 17 | 27 | 7 | 0.468 | 83 | Only 333 laps ran | 16.67% |
| 1998 | 43 | 9 | 33 | 5 | 0.410 | 164 | 11.63% | |
| 1999 | 43 | 7 | 23 | 10 | 0.574 | 198 | 23.26% | |
| 2000 | 43 | 11 | 25 | 6 | 0.573 | 175 | 13.95% | |
| 2001 | 43 | 17 | 28 | 7 | 3.190 | 125 | 16.28% | |
| 2002 | 43 | 11 | 21 | 8 | 0.468 | 263 | 18.60% | |
| 2003 | 43 | 8 | 16 | 7 | Caution | 82 | Only 276 laps ran | 16.28% |
| 2004 | 43 | 13 | 16 | 6 | Caution | 334 | 13.95% | |
| 2005 | 43 | 20 | 37 | 13 | 0.027 | 98 | 30.23% | |
| 2006 | 43 | 17 | 37 | 6 | 2.114 | 158 | 13.95% | |
| 2007 | 43 | 12 | 29 | 10 | 9.561 | 107 | 23.26% | |
| 2008 | 43 | 17 | 37 | 5 | 10.203 | 76 | 11.63% | |
| 2009 | 43 | 26 | 14 | 1 | Caution | 173 | Only 227 laps ran | 2.33% |
| 2010 | 43 | 24 | 33 | 7 | 0.737 | 252 | 16.28% | |
| 2011 | 43 | 19 | 38 | 13 | 0.703 | 103 | 30.23% | |
| 2012 | 43 | 9 | 31 | 10 | 4.295 | 204 | 23.26% | |
| 2013 | 43 | 13 | 24 | 12 | 1.490 | 161 | 27.91% | |
| 2014 | 43 | 13 | 34 | 6 | 1.272 | 164 | 13.95% | |
| 2015 | 43 | 16 | 22 | 4 | 4.785 | 131 | 9.30% | |
| 2016 | 40 | 9 | 9 | 2 | 2.572 | 392 | 5.00% | |
| 2017 | 40 | 17 | 23 | 9 | 0.835 | 233 | 22.50% | |
| 2018 | 40 | 9 | 9 | 5 | 3.823 | 377 | 12.50% |
For those of you who like to throw out the, “it’s just like the old days” comparison you couldn’t be more wrong.
First off, these stats above don’t even factor in how many cars in these races in the ’70s-’90s had crash damage and went back out onto the tracks or had mechanical issues they fixed in the garage, so those cars did not show up as DNFs.
Also, we now have stage racing, double-file restarts, wave around’s and free passes in play. For the sake of comparing apples to apples I’m going to remove any of the above races that were shortened to further breakdown these statistics. That will eliminate 1968, 1997, 2003, and 2009.
We are comparing 46 races below:
For number of cars on the lead lap, there were four times with only a single car on the lead lap, the last coming in 1987. It’s not a coincidence that three of those four events had very high attrition rates. 1987 had 25 DNF’s so 59.52% of the field did not finish. Of the 46 races, 2018 was 15th in number of cars on the lead lap.
For number of lead changes, 1979 wins the prize with 54 lead changes. The 1980 and 1982 races had 47 each, and 1978 and 1988 both had 43. 2018 was tied with 2016 for fewest number of lead changes, with only 9 each. The 1971 race was the next closest with 13 lead changes, however 40 per cent of the field (16 cars) that did not finish. Yes, 2018 is exactly like these old school races that people like me should love. Just look at those striking similarities. Oh, wait.
For most laps led, we would call the lowest high number of laps led the winner in this category. That honor goes to 2008, where the most laps led of any car was 76. Three other occasions saw the highest number of laps led under 100: 1985, 1986, and 2005.
2018 was 45th out of 46, with Kyle Busch leading 377 of the 400 laps ran which was only behind Martin Truex, Jr. in 2016 when he led 392. In fact, there are only four other times where the most laps led were over 300: 2004 (334), 1977 (311), 1990 (306), and 1971 (303). Again, so much like the old days it just blurs the lines.
Now, for the statistic that I always try to beat into people’s brains when they throw out the old days only had a couple of cars on the lead lap garbage. That is the number of cars that did not finish the races. And again, this doesn’t factor in, at all, cars that suffered crash damage or mechanical issues that got back out and actually finished the races. That would be a tall task to dissect each event to get an even clearer picture, but this should suffice.
The highest number of DNFs was 1987 with 59.52 per cent of the field not running at the end. The next was 1969 with 59.09%. Tying for the third-highest attrition rates were 1970, 1972, and 1974 with 57.50% of the cars not finishing those events. And wouldn’t you know, three of the four times there was only a single car on the lead lap was all in the top-five for highest attrition rates. There were only four Coca-Cola 600 events with lower attrition rates than in 2018’s 12.50%: 2016 (5.00%), 2015 (9.30%), and 1998/2008 (11.63%).
I realize that this is a lot of numbers to digest. However, when you look at the correlations and the statistics, anyone who says that the 2018 Coca-Cola 600, and most of these races in 2018 that have been dominated by one car with very few lead changes is just like the old days, is completely and utterly 100% incorrect.
They are factually inaccurate and I’m tired of this rhetoric that the races in 2018 are so much like the old days that some of us are clamoring for because that’s just not the case.
Look at the chart below and see some correlations:
As you can see from the chart the number of lead changes per race were very high from the late ’70s through late ’80s. It was up and down in the ’90s-2010 and then the numbers just fell off of a cliff.
With so few DNF’s in today’s day and age, factored in with the stage cautions, wave around’s, free passes and double file restarts, the racing in 2018 should be substantially better than it was in the ‘good old days’. But it’s not. To compare the racing in 2018 to those good old days is an insult to the races of yesteryear.
Simply, whether some folks want to admit it or not, the current racing product is broken.
I’ve posted several articles about slowing the cars down to make for better racing and trying to decrease aero dependency. The All-Star package is only a band aid but it’s something that’s very much needed at this critical point in NASCAR’s history.
I implore those that just want to randomly throw out that the races in 2018 are so much like these older races to actually go back and watch some of them on YouTube. There is nothing remotely similar between 2018 and the races of the past.
Attrition rates cannot be ignored and I’m tired of people making an argument without actually digging a little deeper behind their numbers.
If nothing else, I hope this shows beyond a shadow of a doubt that the racing in 2018 is most certainly not anything similar to the good old days. But it could get closer with some rules changes that I hope NASCAR is seriously considering. This is a low point in the history of competitive racing in the MENCS.
**The opinions expressed on this site are not necessarily those of the publisher, management or staff. All comments other than website related problems need to be directed to the author. (c)OnPitRoad.com. **


